 |
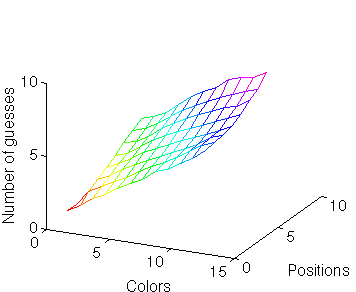
| Figure 1 - Guesses per code solved using heuristic algorithm. |
In playing mastermind, one tries to make the most of previous information and to use the information to narrow the possibilities in order to solve the code in as few steps as possible. One way to do this is to always put guesses on the board that would make answers to previous guesses valid; e.g. if a guess receives no black or white pegs, we know that the code does not have any of the colors in the guess and therefore, using these colors in future guesses would be ineffective.
With each guess that does not contradict previous
ones, we at least have a minimal chance of guessing correctly and at the
same time, we may get additional information.
The procedure just described is easily
coded and follows the following structure:
Performance of the heuristic algorithm
As stated in the introduction our purpose was to study the performance of this algorithm in games with more colors and more positions. We performed this task for as wide a range of codes as the hardware available allowed (see technical notes). The code sets tested ranged from 2 to 12 colors and 1 to 8 positions. This meant that our code spaces ranged from 2 ({2,1}) to 429,981,696 ({12,8}) possible codes. A table with the results is shown below.
c 1
2 3
4 5
6 7
8 9
10 11
12
p
1 1.0
1.50 2.13 2.50
3.02 3.53 3.92
4.63 4.85 5.38
5.87 6.56
2 1.0
2.04 2.49 2.97
3.41 3.89 4.38
4.82 5.28 5.78
6.33 6.69
3 1.0
2.40 2.84 3.36
3.84 4.25 4.66
5.08 5.43 5.90
6.45 6.75
4 1.0
2.82 3.21 3.72
4.24 4.66 5.06
5.44 5.77 6.16
6.55 6.94
5 1.0
3.25 3.50 4.08
4.63 5.08 5.49
5.88 6.22 6.62
6.95 7.31
6 1.0
3.66 3.85 4.38
5.03 5.50 5.97
6.36 6.73 7.12
7.33 7.87
7 1.0
4.06 4.33 4.79
5.43 5.97 6.46
6.88 7.26 7.62
7.96 8.23
8 1.0
4.46 4.75 5.15
5.84 6.49 6.95
7.39 8.04 8.36
8.48 8.97
9 1.0
5.03 5.13 5.98
6.25 7.23 7.75
8.13 8.56 9.14
9.19
10 1.0
5.49 5.50 6.42
6.76 7.84 8.28
8.72 9.36 9.74
|
|
| Figure 1 - Guesses per code solved using heuristic algorithm. |
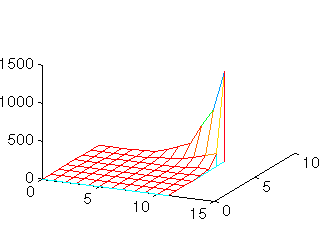
Figure 2, and 3 display the same results in
graphical form. Figure 2 displays the time taken on the z axis with
Colors and Positions on the x and y axis, respectively. Figure 3
displays the time taken in respect to the code set size.
Note: Click on images for a blown-up view.
 |
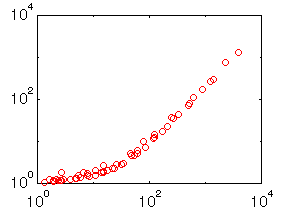 |
| Figure 2 - Heuristic algorithm - seconds per code solved | Figure 3 - Heuristic algorithm - Runtime / code set size |
Top Back - Introduction Definitions Forward - The deep search algorithm Forward - Conclusion